By Charlie Strout, CFA
Professor Edward Altman recently warned of an impending spate of “mega” bankruptcies that will break all the records.[1] As the author of the well-known bankruptcy-predicting Z-Score, Altman knows a thing or two about financial distress, and he doesn’t like what he is seeing. Investors perk up when people start talking about bankruptcy—especially of big companies. Names like Enron and Lehman Brothers spring to mind and remind us the real damage mega-firm failures cause and some truly mammoth companies have that gone bust when the economy goes into a tailspin. If Professor Altman is ringing the alarm, it is worth it to see what his Z-Score is telling him.
The Z-Score
The Z-Score has been around since 1968. There have been a variety of other methods developed since it was first published that seek to improve on its predictive results (Campbell, Hilscher, Szilagyi (CHS) Model, the Ohlson O-Score, and Merton’s Distance to Default) . Altman himself developed Zeta Analysis back in 1977. However, despite these new methodologies—and more than a few analysts urging that we adopt them—the Z-Score is still widely used as an indicator of financial distress.
The original 5-parameter Z-Score was developed specifically for manufacturing companies. Later, a 4-parameter score was developed for non-manufacturing and emerging-markets companies. Each has a slightly different scale as follows:
| Z-Score Scale | High Risk | Grey Area | Low Risk |
| Manufacturing | < 1.81 | Between 2.99 and 1.81 | > 2.99 |
| Non-Manufacturing | < 1.1 | Between 2.6 and 1.1 | > 2.6 |
Z-Score Parameters [2]
| Parameter | Description | |
| X1 | working capital / total assets | Measures liquid assets in relation to the size of the company. |
| X2 | retained earnings / total assets | Measures profitability |
| X3 | earnings before interest and taxes / total assets | Measures operating efficiency |
| X4 | market value of equity / book value of total liabilities (manufacturing) OR
book value of equity / total liabilities (non-manufacturing) |
Adds market dimension (in manufacturing model) |
| X5 | sales / total assets (manufacturing model only) | Standard measure for total asset turnover |
It is important to note that the data from the Z-Score is based mostly on companies’ SEC filings. At the time of writing, most companies had only reported on Q1 2020. This means that much of the really bad news may not be reflected in this analysis. It will likely get worse, much worse. We will be releasing Part 2 of this analysis in August with the Q2 financial results. That should be interesting…
Methodology
For this analysis, I grabbed the list of S&P 500 tickers and divided it into three groups. First, I removed all the companies where the Z-Score didn’t return a value when applied to my data set. (Most of the companies were financial firms where the Z-Score isn’t appropriate.) Then, I put all the companies listed in the manufacturing sector into the manufacturing group (164 firms) and all the remaining 276 firms into the non-manufacturing group. I ran the appropriate Z-Score against each of these groups. Granted, this is a bit “best-effort.” To really know which Z-Score is appropriate for an individual firm you would need to dive in deeper. However, I am comfortable that this is a reasonable approach for a first pass.
Data
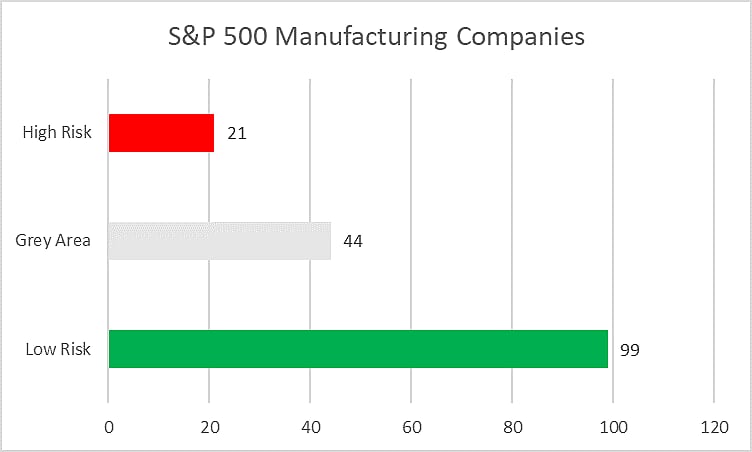
Manufacturing Companies
Distribution of Results for S&P 500 Manufacturing Companies

The 25 S&P 500 Manufacturing Companies with the Highest-Risk Z-Score
| Rank | Ticker | Company | Industry | Z-Score | Risk | Ended |
| 1 | COTY | COTY INC. | Consumer Goods | (0.29) | High | 2020-03-31 |
| 2 | NWL | NEWELL BRANDS INC. | Consumer Goods | 0.37 | High | 2020-03-31 |
| 3 | KHC | KRAFT HEINZ CO | Food, Beverage & Tobacco | 0.83 | High | 2020-03-28 |
| 4 | F | FORD MOTOR CO | Automotive | 0.84 | High | 2020-03-31 |
| 5 | GM | GENERAL MOTORS CO | Automotive | 0.90 | High | 2020-03-31 |
| 6 | TAP | MOLSON COORS BEVERAGE CO | Food, Beverage & Tobacco | 1.02 | High | 2020-03-31 |
| 7 | MYL | MYLAN N.V. | Healthcare Products | 1.08 | High | 2020-03-31 |
| 8 | IR | INGERSOLL RAND INC. | Industrial Goods | 1.10 | High | 2020-03-31 |
| 9 | TPR | TAPESTRY, INC. | Consumer Goods | 1.16 | High | 2020-03-28 |
| 10 | PRGO | PERRIGO CO PLC | Healthcare Products | 1.28 | High | 2020-03-28 |
| 11 | PVH | PVH CORP. /DE/ | Consumer Goods | 1.29 | High | 2020-05-03 |
| 12 | BA | BOEING CO | Industrial Goods | 1.36 | High | 2020-03-31 |
| 13 | TDG | TRANSDIGM GROUP INC | Industrial Goods | 1.38 | High | 2020-03-28 |
| 14 | IP | INTERNATIONAL PAPER CO /NEW/ | Consumer Goods | 1.47 | High | 2020-03-31 |
| 15 | JCI | JOHNSON CONTROLS INTERNATIONAL PLC | Industrial Goods | 1.58 | High | 2020-03-31 |
| 16 | JNPR | JUNIPER NETWORKS INC | Technology Hardware | 1.59 | High | 2020-03-31 |
| 17 | WDC | WESTERN DIGITAL CORP | Technology Hardware | 1.61 | High | 2020-04-03 |
| 18 | IQV | IQVIA HOLDINGS INC. | Healthcare Products | 1.71 | High | 2020-06-30 |
| 19 | WAB | WESTINGHOUSE AIR BRAKE TECHNOLOGIES CORP | Industrial Goods | 1.72 | High | 2020-03-31 |
| 20 | CAG | CONAGRA BRANDS INC. | Food, Beverage & Tobacco | 1.78 | High | 2020-05-31 |
| 21 | SJM | J M SMUCKER CO | Food, Beverage & Tobacco | 1.79 | High | 2020-04-30 |
| 22 | BMY | BRISTOL MYERS SQUIBB CO | Healthcare Products | 1.83 | Medium | 2020-03-31 |
| 23 | AVGO | BROADCOM INC. | Technology Hardware | 1.87 | Medium | 2020-05-03 |
| 24 | MCHP | MICROCHIP TECHNOLOGY INC | Technology Hardware | 2.04 | Medium | 2020-03-31 |
| 25 | NTAP | NETAPP, INC. | Technology Hardware | 2.05 | Medium | 2020-04-24 |
The 25 S&P 500 Manufacturing Companies with the Lowest-Risk Z-Score
| Rank | Ticker | Company | Industry | Z-Score | Risk | Ended |
| 1 | ABMD | ABIOMED INC | Healthcare Products | 55.89 | Low | 2020-03-31 |
| 2 | ISRG | INTUITIVE SURGICAL INC | Healthcare Products | 38.03 | Low | 2020-06-30 |
| 3 | MNST | MONSTER BEVERAGE CORP | Food, Beverage & Tobacco | 27.75 | Low | 2020-03-31 |
| 4 | IPGP | IPG PHOTONICS CORP | Technology Hardware | 19.96 | Low | 2020-03-31 |
| 5 | VRTX | VERTEX PHARMACEUTICALS INC / MA | Healthcare Products | 19.59 | Low | 2020-03-31 |
| 6 | AMD | ADVANCED MICRO DEVICES INC | Technology Hardware | 18.53 | Low | 2020-03-28 |
| 7 | SWKS | SKYWORKS SOLUTIONS, INC. | Technology Hardware | 18.05 | Low | 2020-06-26 |
| 8 | NVDA | NVIDIA CORP | Technology Hardware | 17.85 | Low | 2020-04-26 |
| 9 | WST | WEST PHARMACEUTICAL SERVICES INC | Healthcare Products | 17.78 | Low | 2020-06-30 |
| 10 | DXCM | DEXCOM INC | Healthcare Products | 17.07 | Low | 2020-03-31 |
| 11 | INCY | INCYTE CORP | Healthcare Products | 15.71 | Low | 2020-03-31 |
| 12 | ILMN | ILLUMINA, INC. | Healthcare Products | 15.21 | Low | 2020-03-29 |
| 13 | ALGN | ALIGN TECHNOLOGY INC | Healthcare Products | 14.67 | Low | 2020-03-31 |
| 14 | IDXX | IDEXX LABORATORIES INC /DE | Healthcare Products | 13.98 | Low | 2020-03-31 |
| 15 | REGN | REGENERON PHARMACEUTICALS, INC. | Healthcare Products | 13.85 | Low | 2020-03-31 |
| 16 | TXN | TEXAS INSTRUMENTS INC | Technology Hardware | 12.96 | Low | 2020-06-30 |
| 17 | GRMN | GARMIN LTD | Technology Hardware | 12.31 | Low | 2020-03-28 |
| 18 | HRL | HORMEL FOODS CORP /DE/ | Food, Beverage & Tobacco | 10.15 | Low | 2020-04-26 |
| 19 | MTD | METTLER TOLEDO INTERNATIONAL INC/ | Technology Hardware | 9.17 | Low | 2020-03-31 |
| 20 | XLNX | XILINX INC | Technology Hardware | 8.65 | Low | 2020-03-28 |
| 21 | WAT | WATERS CORP /DE/ | Technology Hardware | 8.32 | Low | 2020-03-28 |
| 22 | MXIM | MAXIM INTEGRATED PRODUCTS INC | Technology Hardware | 8.26 | Low | 2020-03-28 |
| 23 | ITW | ILLINOIS TOOL WORKS INC | Industrial Goods | 7.27 | Low | 2020-03-31 |
| 24 | EW | EDWARDS LIFESCIENCES CORP | Healthcare Products | 7.25 | Low | 2020-03-31 |
| 25 | SNPS | SYNOPSYS INC | Technology Hardware | 7.19 | Low | 2020-04-30 |
Non-Manufacturing Companies
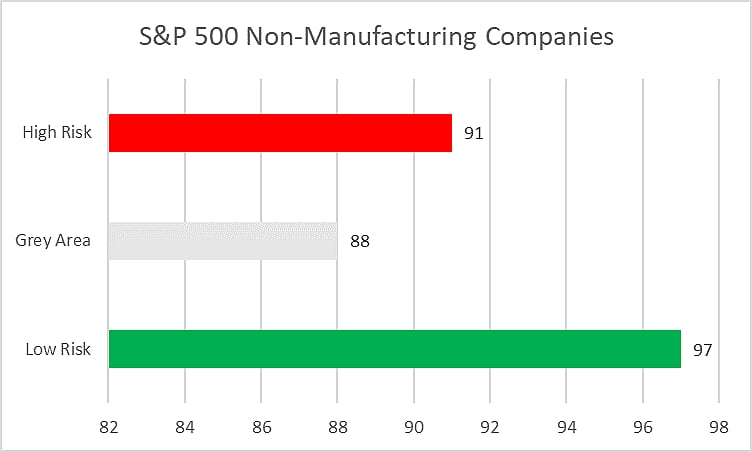
In the sample, the Z-Score rated the a full 35% (91 of 276) of non-manufacturing companies to high risk. Fewer than half were rated low risk.
Distribution of Results for S&P 500 Manufacturing Companies

The 25 S&P 500 Non-Manufacturing Companies with the Highest-Risk Z-Score
| Rank | Ticker | Company | Sector | Industry | Z-Score | Risk | Quarter Ending |
| 1 | VRSN | VERISIGN INC/CA | Services | Technology Services | (25.24) | High | 2020-06-30 |
| 2 | APA | APACHE CORP | Resources | Energy | (6.14) | High | 2020-03-31 |
| 3 | CXO | CONCHO RESOURCES INC | Resources | Energy | (5.53) | High | 2020-03-31 |
| 4 | DPZ | DOMINOS PIZZA INC | Services | Hospitality | (2.76) | High | 2020-06-14 |
| 5 | EXR | EXTRA SPACE STORAGE INC. | Financial | REITs | (2.69) | High | 2020-03-31 |
| 6 | VTR | VENTAS, INC. | Financial | REITs | (2.48) | High | 2020-03-31 |
| 7 | SBAC | SBA COMMUNICATIONS CORP | Financial | REITs | (2.41) | High | 2020-03-31 |
| 8 | YUM | YUM BRANDS INC | Services | Hospitality | (2.31) | High | 2020-03-31 |
| 9 | NBL | NOBLE ENERGY INC | Resources | Energy | (2.21) | High | 2020-03-31 |
| 10 | NOV | NATIONAL OILWELL VARCO INC | Resources | Energy | (2.14) | High | 2020-03-31 |
| 11 | BKR | BAKER HUGHES CO | Resources | Energy | (1.90) | High | 2020-06-30 |
| 12 | ADSK | AUTODESK, INC. | Services | Technology Services | (1.53) | High | 2020-04-30 |
| 13 | DXC | DXC TECHNOLOGY CO | Services | Business Services | (1.41) | High | 2020-03-31 |
| 14 | O | REALTY INCOME CORP | Financial | REITs | (1.23) | High | 2020-03-31 |
| 15 | LB | L BRANDS, INC. | Trade | Retail | (1.09) | High | 2020-05-02 |
| 16 | SLB | SCHLUMBERGER LIMITED/NV | Resources | Energy | (0.96) | High | 2020-03-31 |
| 17 | AAL | AMERICAN AIRLINES GROUP INC. | Services | Transportation | (0.95) | High | 2020-06-30 |
| 18 | SBUX | STARBUCKS CORP | Services | Hospitality | (0.78) | High | 2020-03-29 |
| 19 | NLOK | NORTONLIFELOCK INC. | Services | Technology Services | (0.71) | High | 2020-04-03 |
| 20 | EXPE | EXPEDIA GROUP, INC. | Services | Technology Services | (0.56) | High | 2020-03-31 |
| 21 | NLSN | NIELSEN HOLDINGS PLC | Services | Business Services | (0.42) | High | 2020-03-31 |
| 22 | CAH | CARDINAL HEALTH INC | Trade | Wholesale | (0.39) | High | 2020-03-31 |
| 23 | HLT | HILTON WORLDWIDE HOLDINGS INC. | Services | Hospitality | (0.34) | High | 2020-03-31 |
| 24 | AIV | APARTMENT INVESTMENT & MANAGEMENT CO | Financial | REITs | (0.29) | High | 2020-03-31 |
| 25 | CCI | CROWN CASTLE INTERNATIONAL CORP | Financial | REITs | (0.25) | High | 2020-03-31 |
The 25 S&P 500 Non-Manufacturing Companies with the Lowest-Risk Z-Score
| Rank | Ticker | Company | Sector | Industry | Z-Score | Risk | Quarter Ending |
| 1 | NVR | NVR INC | Services | Construction | 12.77 | Low | 2020-03-31 |
| 2 | MKTX | MARKETAXESS HOLDINGS INC | Financial | Financial Services | 12.32 | Low | 2020-06-30 |
| 3 | TROW | PRICE T ROWE GROUP INC | Financial | Financial Services | 10.30 | Low | 2020-03-31 |
| 4 | FAST | FASTENAL CO | Trade | Wholesale | 9.44 | Low | 2020-06-30 |
| 5 | ANET | ARISTA NETWORKS, INC. | Services | Technology Services | 9.35 | Low | 2020-03-31 |
| 6 | INTU | INTUIT INC | Services | Technology Services | 9.22 | Low | 2020-04-30 |
| 7 | FB | FACEBOOK INC | Services | Technology Services | 8.57 | Low | 2020-03-31 |
| 8 | GWW | W.W. GRAINGER, INC. | Trade | Wholesale | 8.36 | Low | 2020-06-30 |
| 9 | GOOGL | ALPHABET INC. | Services | Technology Services | 8.28 | Low | 2020-03-31 |
| 10 | BEN | FRANKLIN RESOURCES INC | Financial | Financial Services | 8.10 | Low | 2020-03-31 |
| 11 | BKNG | BOOKING HOLDINGS INC. | Services | Technology Services | 7.93 | Low | 2020-03-31 |
| 12 | MA | MASTERCARD INC | Financial | Financial Services | 7.90 | Low | 2020-03-31 |
| 13 | ODFL | OLD DOMINION FREIGHT LINE, INC. | Services | Transportation | 7.80 | Low | 2020-03-31 |
| 14 | EXPD | EXPEDITORS INTERNATIONAL OF WASHINGTON INC | Services | Transportation | 7.63 | Low | 2020-03-31 |
| 15 | DHI | HORTON D R INC /DE/ | Services | Construction | 7.60 | Low | 2020-03-31 |
| 16 | EA | ELECTRONIC ARTS INC. | Services | Technology Services | 7.48 | Low | 2020-03-31 |
| 17 | CPRT | COPART INC | Trade | Wholesale | 7.28 | Low | 2020-04-30 |
| 18 | LEN | LENNAR CORP /NEW/ | Services | Construction | 7.16 | Low | 2020-05-31 |
| 19 | JKHY | HENRY JACK & ASSOCIATES INC | Services | Technology Services | 7.12 | Low | 2020-03-31 |
| 20 | ANSS | ANSYS INC | Services | Technology Services | 7.00 | Low | 2020-03-31 |
| 21 | CTSH | COGNIZANT TECHNOLOGY SOLUTIONS CORP | Services | Business Services | 6.66 | Low | 2020-03-31 |
| 22 | SPGI | S&P GLOBAL INC. | Services | Business Services | 6.55 | Low | 2020-03-31 |
| 23 | NUE | NUCOR CORP | Resources | Metals & Mining | 6.22 | Low | 2020-04-04 |
| 24 | TYL | TYLER TECHNOLOGIES INC | Services | Technology Services | 6.20 | Low | 2020-03-31 |
| 25 | CTAS | CINTAS CORP | Services | Business Services | 5.97 | Low | 2020-02-29 |
Additional Breakdowns
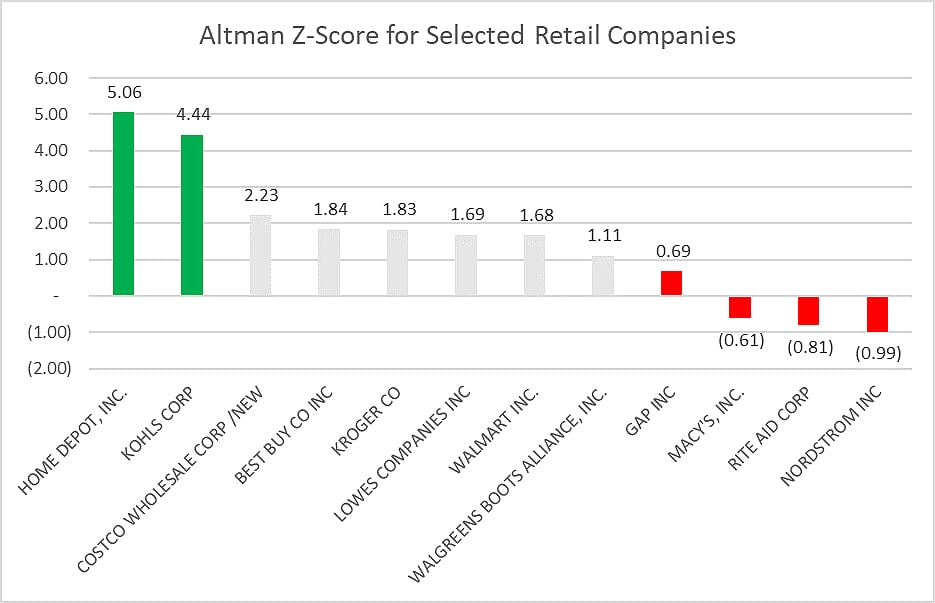
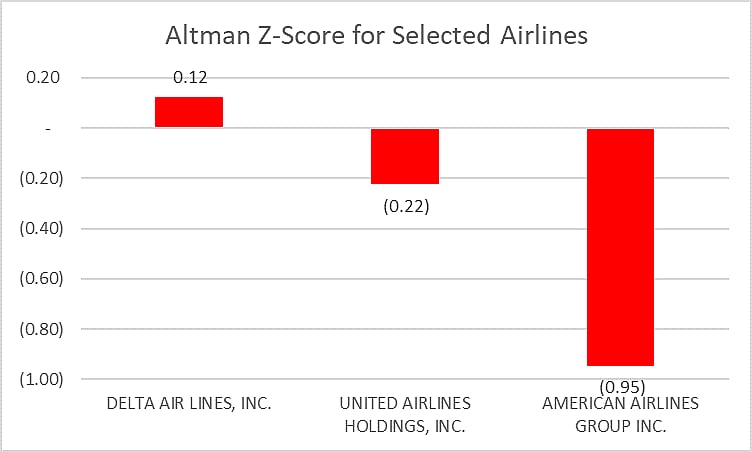
Not too surprising to find Facebook and Google on this list of companies at low risk of going bankrupt given all of the cash that they have stashed away. Just for the fun of it, I took a look at some selected retail companies and airlines.
Retail

Airlines

Results of Altman Non-Manufacturing Z-Score Analysis
Filings Data from Quarter Ending March 31, 2020
The full set of parameters can be found on the supporting Excel document in GitHub.
Analysis
As an initial step we are going to compare the five highest-risk manufacturing firms with the lowest risk.
Comparison of Low vs. High Risk Manufacturing
| Ticker | COTY | NWL | KHC | F | GM | ABMD | ISRG | MNST | IPGP | VRTX | SWKS |
| X1 | 0.04 | 0.08 | 0.04 | 0.14 | 0.05 | 0.50 | 0.59 | 0.33 | 0.75 | 0.53 | 0.46 |
| X2 | (0.37) | (0.37) | (0.04) | 0.09 | 0.15 | 0.69 | 0.36 | 1.52 | 1.08 | (0.20) | 1.29 |
| X3 | (0.53) | (0.45) | 0.10 | (0.03) | 0.02 | 0.68 | 0.37 | 0.98 | 0.25 | 0.61 | 0.56 |
| X4 | 0.12 | 0.43 | 0.49 | 0.07 | 0.11 | 54.45 | 37.37 | 24.81 | 18.03 | 18.12 | 15.67 |
| X5 | 0.43 | 0.69 | 0.24 | 0.57 | 0.49 | 0.69 | 0.43 | 0.88 | 0.47 | 0.54 | 0.64 |
| Z-Score | (0.30) | 0.38 | 0.85 | 0.84 | 0.81 | 57.01 | 39.12 | 28.53 | 20.57 | 19.60 | 18.60 |
| Risk | High | High | High | High | High | Low | Low | Low | Low | Low | Low |
Review of the above chart shows how much influence X4 (market value of equity / book value of total liabilities) has. This makes sense as it gives a view of what people think the company is worth vs. how much it owes. However, also note that X1, X2, and X3 are also all consistently lower for the high-risk companies. Notice both Ford and GM have made this list. It may be worth digging into whether there is a particularity of in capital structure in the automotive industry that results in these high-risk scores.
Comparison of Low vs. High Risk Non-Manufacturing
| Ticker | VRSN | APA | CXO | DPZ | EXR | NVR | MKTX | FAST | ANET | INTU |
| X1 | 0.83 | (0.06) | 0.58 | 1.94 | (3.53) | 2.63 | 3.25 | 3.17 | 4.41 | 1.82 |
| X2 | (28.64) | (2.45) | (1.44) | (6.82) | (0.14) | 6.78 | 2.21 | 2.23 | 1.35 | 4.44 |
| X3 | 3.02 | (3.61) | (6.34) | 2.83 | 0.50 | 1.65 | 2.08 | 1.82 | 1.24 | 1.33 |
| X4 | (0.45) | (0.02) | 1.66 | (0.70) | 0.47 | 1.71 | 4.78 | 2.22 | 2.35 | 1.63 |
| Z-Score | (25.24) | (6.14) | (5.53) | (2.76) | (2.69) | 12.77 | 12.32 | 9.44 | 9.35 | 9.22 |
| Risk | High | High | High | High | High | Low | Low | Low | Low | Low |
For non-manufacturing companies the profitability measure (X2: retained earnings / total assets) drive the differences. However, X4 also is a significant factor even though it is calculated differently for non-manufacturing companies.
Other items that show through is the large number of REITs that are listed as the highest risk companies. This is particularly troubling given that the full impacts of COVID are likely not reflected in the filings data at this time.
Conclusion
Of the 440 companies analyzed, 112—a full 25%—were rated as high risk by the Altman Z-Score. A full third of non-manufacturing companies rated as high risk. This does give one pause. This analysis is just a first pass, but it certainly does explain why Professor Altman is ringing the alarms. Research is always a journey where one analysis lead to more questions to explore. The questions that come to mind when viewing the results of this quick Z-Score analysis are:
- Do other measures of financial distress produce similar results?
- If they do, is this information truly priced into the market?
- What will this look like when the full set of second quarter earnings are in?
- Where are the risks and opportunities?
More to come…
Data Provided by TagniFi. More at https://tagnifi.com/.
Charlie Strout is founder of Seven Shadow LLC, and independent research and consulting firm. More on Charlie can be found at https://charliestrout.com/.
DISCLAIMER: This article is for informational purposes only. Nothing in it is intended as advice to buy or sell a security.