Highlights
“With over 300,000 companies and $13 trillion of revenue, the middle-market continues to be an attractive target for acquisition opportunities.”
What Exactly Is The Middle-Market?
On the front page of our website we say “Financial Data For Middle-Market Firms” in bold letters. We are often asked how we define the middle-market and our standard response is that the middle-market is made up of companies with between $10 million and $1 billion of revenue. This is a good starting point, but what exactly does the middle-market look like?
Triangulating Our Way To The Middle-Market
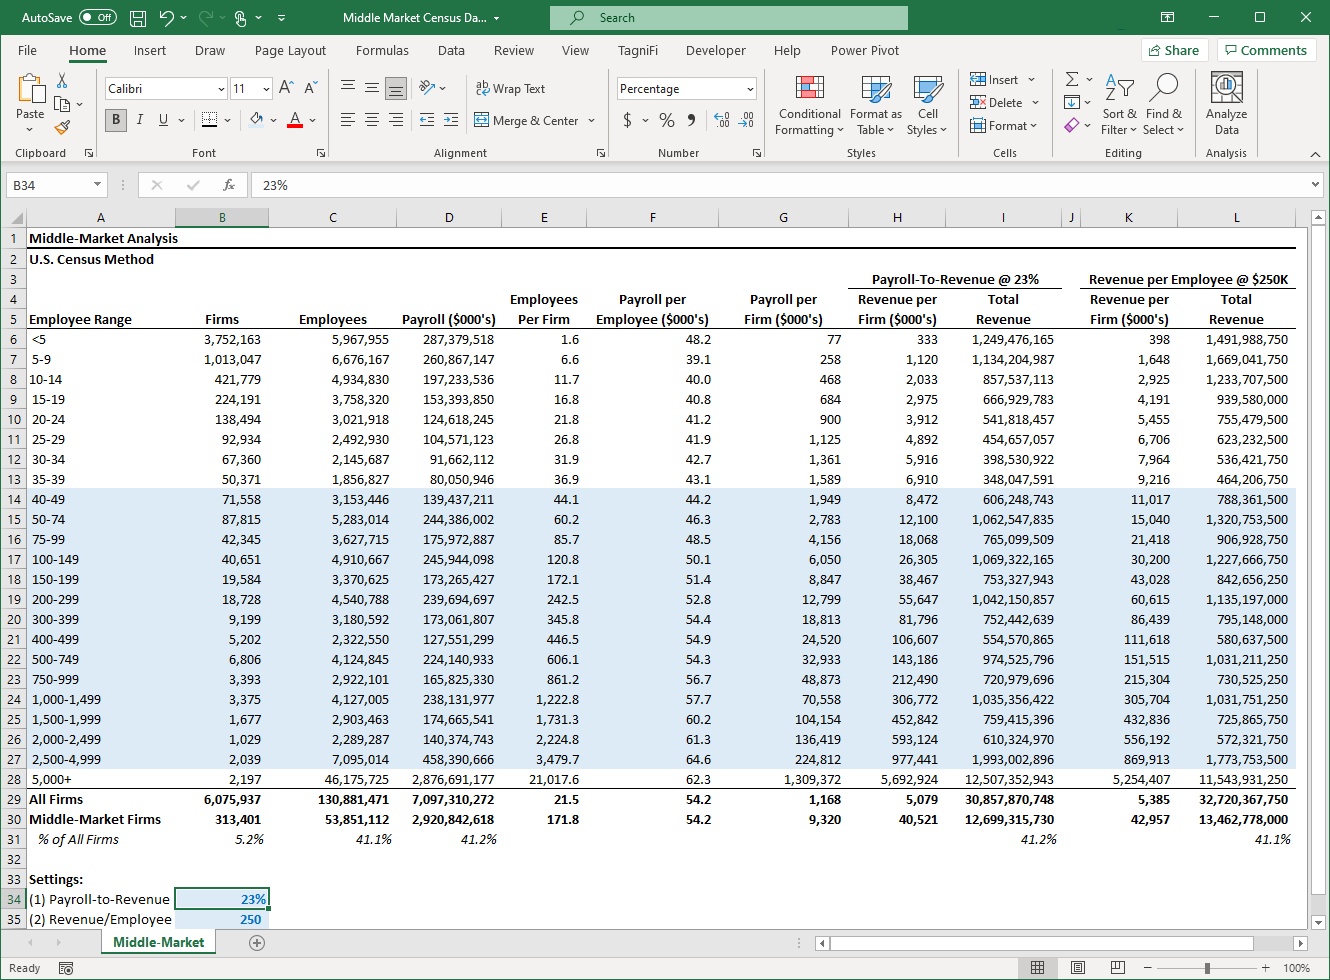
With that definition in mind, we’ve put together this analysis based on U.S. Census data that delivers a more comprehensive picture than just “companies with between $10 million and $1 billion of revenue.”
U.S. Census delivers employee and payroll data but not revenue data so we don’t know exactly how many companies in the country have revenue between $10 million and $1 billion but we can get pretty close with some rules of thumb.
Rule Of Thumb #1: Payroll-To-Revenue
The first rule of thumb we can use to estimate revenue is the payroll-to-revenue ratio. There are several publications out there that suggest the average payroll-to-revenue ratio is between 15% and 30% depending on the industry. Labor-intensive industries will be higher than this range and the more capital-intensive industries will be lower than this range but across industries, we are using the midpoint (23%) of the payroll-to-revenue ratio to arrive at our estimated revenue by firm size.
Using this approach, we can use the average payroll per employee of $46K which puts us at exactly 50 employees to hit $2.3 million of total payroll. For our 50-person firm, this results in exactly $10 million of revenue assuming a 23% payroll-to-revenue ratio.
Based on this approach we can say the lower limit of the middle-market is around 50 employees.
Click Image to Enlarge
Rule Of Thumb #2: Revenue Per Employee
Wouldn’t it be great if we had a sample of companies that disclosed their revenue and employee counts on a periodic basis so that we could estimate revenue per employee? We’re in luck because we just happen to have 8,000 public companies in our database with both revenue and employee totals. We ran an analysis of the public companies in the TagniFi database and the average revenue per employee, excluding financials and insurance companies, was about $300K. Public companies tend to be larger than the population of all companies so we adjusted this down to $250K of revenue per employee.
At $250K of revenue per employee, we cross into the $10 million middle-market thresholds at 40 total employees.
Middle-Market Statistics
Using our rules of thumb we’ve determined that the middle-market starts somewhere between 40 and 50 employees so we’ve included the category of 40-49 employees as the lower bounds of the middle market. At the upper range, we’ve included firms with employees of 2,500-4,999 since this category gets us very close to the $1 billion middle-market upper revenue limit ($977 million using the payroll-to-revenue approach).
With these assumptions of the middle-market defined, we can now look at some key statistics on the middle-market.
- There are approximately 313,000 middle-market firms in the U.S. (5% of all firms).
- Middle-market firms employ over 53 million people in the U.S. (41% of all employees).
- The average number of employees at a middle-market firm is 172.
- The average payroll per employee is $54K at middle-market firms.
- The total annual payroll across all middle-market firms is $3 trillion.
- The average revenue for a middle-market firm is $41 million.
- Total revenue across middle-market firms is $13 trillion.
With over 300,000 companies and $13 trillion of revenue, the middle-market continues to be an attractive target for acquisition opportunities. We help middle-market advisors and investors with the data needed to capitalize on these opportunities.