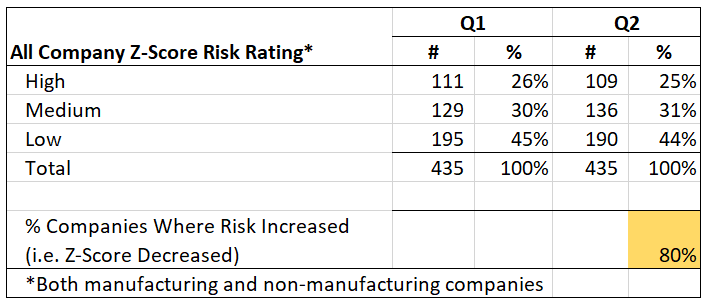
Last month in Part 1, we reported that 25% of S&P 500 companies were at a high risk for bankruptcy according to the Altman Z-Score. At that time, most companies had not reported Q2 results, so the pandemic’s impact had not been fully reflected in our data. In this month’s post, we revisited the Z-Score and discovered that overall bankruptcy risk has risen. The percentage of companies at high risk held constant at approximately 25%, but the Z-Score-measured bankruptcy risk rose in 80% of S&P 500 companies. Furthermore, we identified three key industries–REITs, Energy, and Hospitality that were disproportionately represented in the list of riskiest companies.
Company Universe
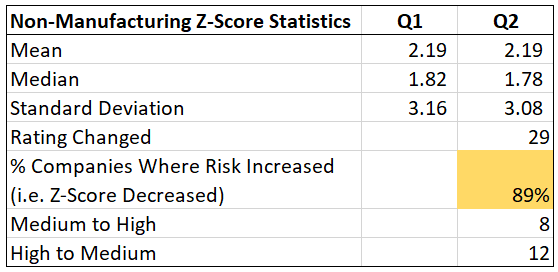
The universe for this article is 435 non-financial S&P 500 companies. The Altman Z-Score is not appropriate for financial companies, so we removed them and a few other miscellaneous firms. The companies were then split into a manufacturing cohort (164) and a non-manufacturing cohort (271) based on their sector designation. The appropriate Z-Score model was applied to each. After performing the analysis, we continue to be wary of the high percentage of companies that the Z-Score rates as having a high risk of bankruptcy, especially given the fact that the overall amount of risk increased over our results from Q1 2020. In particular, we noted that 80% of companies saw their Z-Score decrease (i.e. risk increase) since part 1 of our analysis. That the proportion of companies at a high-risk of bankruptcy stayed constant at about 25% can be seen as good news. Things didn’t get dramatically worse, but 25% still feels like a high percentage of companies at risk of going under, especially given the size of companies in the S&P 500 index.
Manufacturing Companies
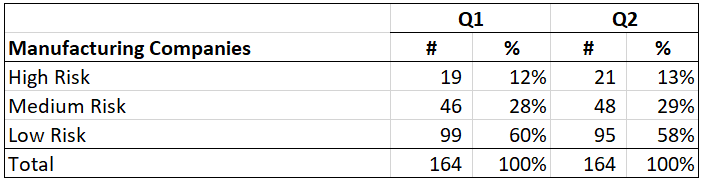
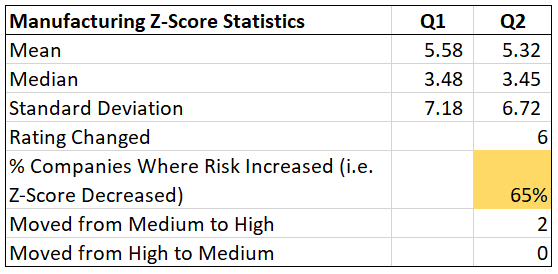
The Z-Score rated a slightly higher percentage of manufacturing companies at a high risk of bankruptcy in Q2 (13%) over Q1 (12%). This was the result of two companies (the biotech company Abbvie (ABBV) and the clothing manufacturer Under Armour (UA)) moving from medium to high. Four companies moved from low to medium risk (Ralph Lauren (RL), Xylem (XYL), VF Corp (VFC), and Vulcan Materials (VMC)). Interestingly, half of the companies with rising risk levels are clothing manufacturers. VF Corp is the holding company for brands like The North Face, Vans and Timberland. This is perhaps explained by the retail segments of their businesses that have been negatively impacted by the pandemic.
The rising bankruptcy risk in the manufacturing cohort was widespread. Both the mean and the median Z-Scores deteriorated slightly from Q1, and 65% of the companies saw their Z-Score-measured bankruptcy risk rise.
Top 25 Manufacturing Companies Most at Risk for Bankruptcy
| Q2 Rank | Ticker | Company | Sector | Industry | Z-Score | Risk | Q1 Rank | Rank Change |
| 1 | COTY | COTY INC. | Manufacturing | Consumer Goods | (0.29) | High | 1 | 0 |
| 2 | NWL | NEWELL BRANDS INC. | Manufacturing | Consumer Goods | 0.34 | High | 2 | 0 |
| 3 | F | FORD MOTOR CO | Manufacturing | Automotive | 0.73 | High | 4 | -1 |
| 4 | KHC | KRAFT HEINZ CO | Manufacturing | Food, Beverage & Tobacco | 0.77 | High | 5 | -1 |
| 5 | TPR | TAPESTRY, INC. | Manufacturing | Consumer Goods | 0.79 | High | 3 | 2 |
| 6 | GM | GENERAL MOTORS CO | Manufacturing | Automotive | 0.83 | High | 6 | 0 |
| 7 | MYL | MYLAN N.V. | Manufacturing | Healthcare Products | 1.02 | High | 8 | -1 |
| 8 | TAP | MOLSON COORS BEVERAGE CO | Manufacturing | Food, Beverage & Tobacco | 1.04 | High | 7 | 1 |
| 9 | ABBV | ABBVIE INC. | Manufacturing | Healthcare Products | 1.14 | High | 33 | -24 |
| 10 | PRGO | PERRIGO CO PLC | Manufacturing | Healthcare Products | 1.21 | High | 10 | 0 |
| 11 | PVH | PVH CORP. /DE/ | Manufacturing | Consumer Goods | 1.31 | High | 18 | -7 |
| 12 | BA | BOEING CO | Manufacturing | Industrial Goods | 1.33 | High | 11 | 1 |
| 13 | IR | INGERSOLL RAND INC. | Manufacturing | Industrial Goods | 1.41 | High | 9 | 4 |
| 14 | TDG | TRANSDIGM GROUP INC | Manufacturing | Industrial Goods | 1.42 | High | 14 | 0 |
| 15 | IP | INTERNATIONAL PAPER CO /NEW/ | Manufacturing | Consumer Goods | 1.48 | High | 13 | 2 |
| 16 | WDC | WESTERN DIGITAL CORP | Manufacturing | Technology Hardware | 1.52 | High | 12 | 4 |
| 17 | JCI | JOHNSON CONTROLS INTERNATIONAL PLC | Manufacturing | Industrial Goods | 1.52 | High | 16 | 1 |
| 18 | JNPR | JUNIPER NETWORKS INC | Manufacturing | Technology Hardware | 1.54 | High | 15 | 3 |
| 19 | IQV | IQVIA HOLDINGS INC. | Manufacturing | Healthcare Products | 1.70 | High | 21 | -2 |
| 20 | UA | UNDER ARMOUR, INC. | Manufacturing | Consumer Goods | 1.74 | High | 25 | -5 |
| 21 | WAB | WESTINGHOUSE AIR BRAKE TECHNOLOGIES CORP | Manufacturing | Industrial Goods | 1.74 | High | 19 | 2 |
| 22 | CAG | CONAGRA BRANDS INC. | Manufacturing | Food, Beverage & Tobacco | 1.81 | Medium | 21 | 1 |
| 23 | SJM | J M SMUCKER CO | Manufacturing | Food, Beverage & Tobacco | 1.83 | Medium | 20 | 3 |
| 24 | BMY | BRISTOL MYERS SQUIBB CO | Manufacturing | Healthcare Products | 1.90 | Medium | 23 | 1 |
| 25 | AVGO | BROADCOM INC. | Manufacturing | Technology Hardware | 1.99 | Medium | 24 | 1 |
Non-Manufacturing Companies
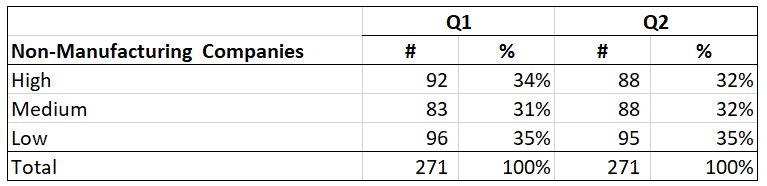
The percentage of non-manufacturing companies with a high risk of bankruptcy actually fell from 34% in Q1 2020 to 32%. This was the result of a net of 4 of the 271 firms moving from high risk to medium. The number of low-risk companies fell from 96 to 95.
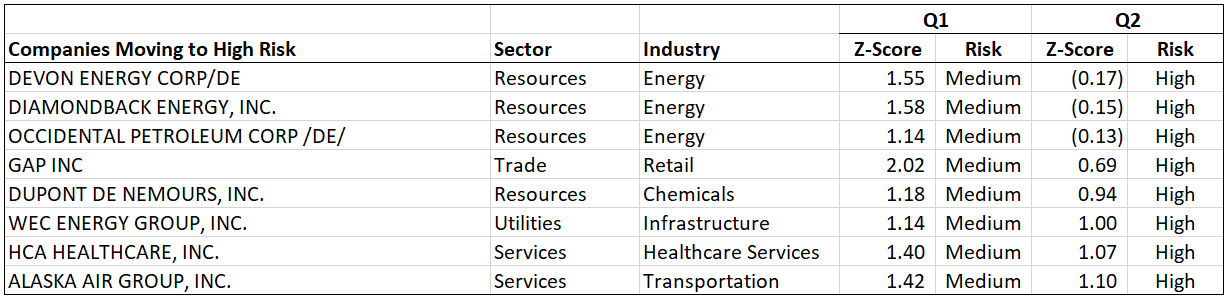
Note that almost half of the companies moving into the high-risk category were in the energy sector. Also, Alaska Air (ALK) joins the major carriers (AAL, DAL, and UAL) with its new high-risk rating. GAP is listed in retail but most likely has a lot of similarities with the other apparel firms covered in the manufacturing analysis above.
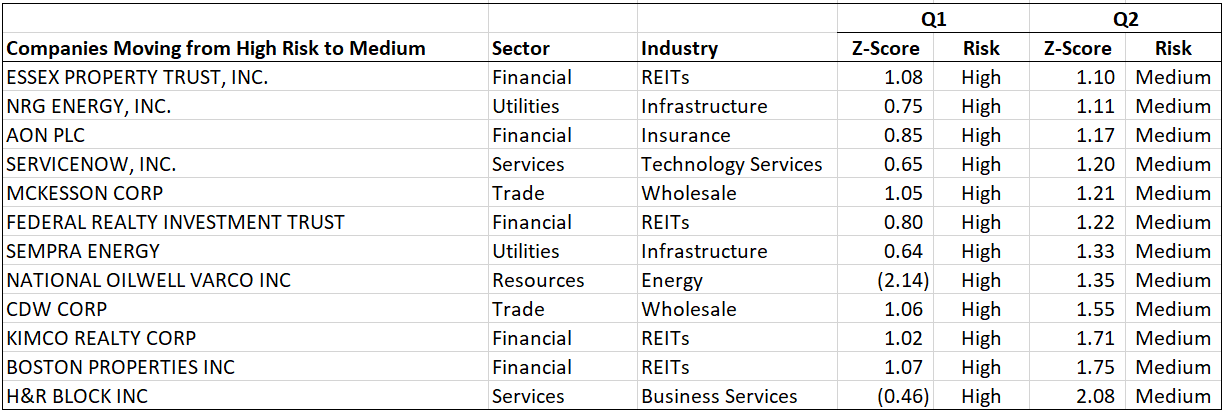
Interestingly, several REITs moved out of high risk into the medium risk category. We will take a deeper dive into REITs later in this article.
Top 25 Non-Manufacturing Companies Most at Risk for Bankruptcy
| Q2 2020 Rank | Ticker | Company | Sector | Industry | Z-Score | Risk | Q1 Rank | Rank Change |
| 1 | VRSN | VERISIGN INC/CA | Services | Technology Services | (25.24) | High | 1 | 0 |
| 2 | APA | APACHE CORP | Resources | Energy | (6.60) | High | 2 | 0 |
| 3 | CXO | CONCHO RESOURCES INC | Resources | Energy | (6.12) | High | 3 | 0 |
| 4 | NBL | NOBLE ENERGY INC | Resources | Energy | (3.04) | High | 9 | -5 |
| 5 | VTR | VENTAS, INC. | Financial | REITs | (2.78) | High | 6 | -1 |
| 6 | EXR | EXTRA SPACE STORAGE INC. | Financial | REITs | (2.76) | High | 5 | 1 |
| 7 | DPZ | DOMINOS PIZZA INC | Services | Hospitality | (2.76) | High | 4 | 3 |
| 8 | SLB | SCHLUMBERGER LIMITED/NV | Resources | Energy | (2.15) | High | 18 | -10 |
| 9 | NLOK | NORTONLIFELOCK INC. | Services | Technology Services | (1.97) | High | 16 | -7 |
| 10 | YUM | YUM BRANDS INC | Services | Hospitality | (1.91) | High | 10 | 0 |
| 11 | SBAC | SBA COMMUNICATIONS CORP | Financial | REITs | (1.91) | High | 7 | 4 |
| 12 | BKR | BAKER HUGHES CO | Resources | Energy | (1.90) | High | 11 | 1 |
| 13 | ADSK | AUTODESK, INC. | Services | Technology Services | (1.53) | High | 13 | 0 |
| 14 | FTI | TECHNIPFMC PLC | (1.51) | High | 12 | 2 | ||
| 15 | O | REALTY INCOME CORP | Financial | REITs | (1.34) | High | 17 | -2 |
| 16 | DXC | DXC TECHNOLOGY CO | Services | Business Services | (1.15) | High | 14 | 2 |
| 17 | LB | L BRANDS, INC. | Trade | Retail | (1.09) | High | 30 | -13 |
| 18 | AAL | AMERICAN AIRLINES GROUP INC. | Services | Transportation | (0.95) | High | 15 | 3 |
| 19 | SBUX | STARBUCKS CORP | Services | Hospitality | (0.84) | High | 19 | 0 |
| 20 | AIV | APARTMENT INVESTMENT & MANAGEMENT CO | Financial | REITs | (0.26) | High | 25 | -5 |
| 21 | UAL | UNITED AIRLINES HOLDINGS, INC. | Services | Transportation | (0.22) | High | 34 | -13 |
| 22 | HLT | HILTON WORLDWIDE HOLDINGS INC. | Services | Hospitality | (0.21) | High | 24 | -2 |
| 23 | UDR | UDR, INC. | Financial | REITs | (0.21) | High | 29 | -6 |
| 24 | LYV | LIVE NATION ENTERTAINMENT, INC. | Services | Media | (0.19) | High | 34 | -10 |
| 25 | DVN | DEVON ENERGY CORP/DE | Resources | Energy | (0.17) | High | 119 | -94 |
Real Estate Investment Trusts (REITs), Energy, and Hospitality Overview
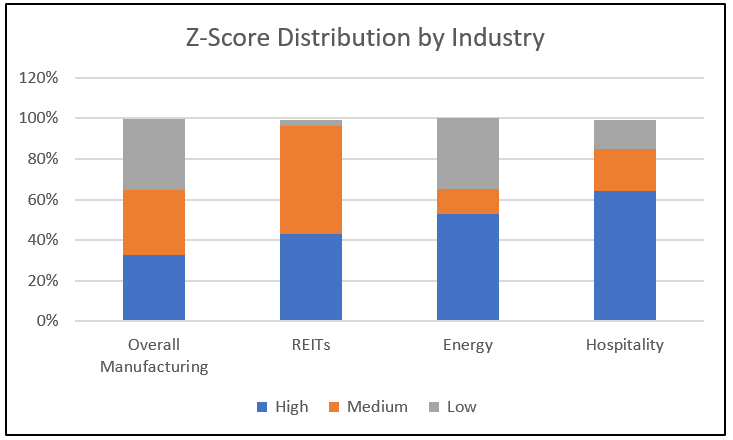
The high-risk companies are not evenly distributed across all industries. A far larger proportion of REITs, Energy, and Hospitality firms are listed in the top 25 riskiest non-manufacturing firms than their underlying proportion in the cohort. For example, REITs makeup just over 10% of the cohort firms but are almost 25% of the riskiest 25. The same is true for Energy firms. Hospitality is the most dramatic, and given the shutdown of the travel industry by the pandemic, it is not all that surprising that over 15% of the riskiest firms are in Hospitality industries while they only make up 5% of the cohort. It is also important to note that all major airlines are listed as high risk, so even though the percentage of high-risk Transportation firms isn’t as high as the other sectors, there is significant risk in the Transportation sector.
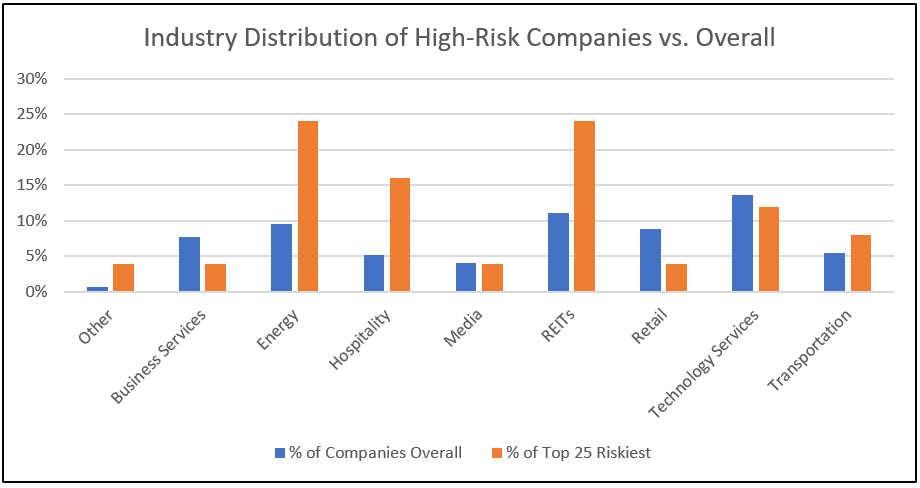
Taking a look at the distribution of risk levels within REITs, Energy, and Hospitality, we can see that a far higher percentage of firms are facing difficulties. Hospitality looks the worst with over 60% of firms rating high risk. Nearly all of the REITs are either medium or high risk. The energy industry appears to be bifurcated between high-and low-risk firms. Even in Energy, however, 53% of firms are high risk vs. 32% for non-manufacturing overall.
Z-Score Analysis for REITs, Energy, and Hospitality
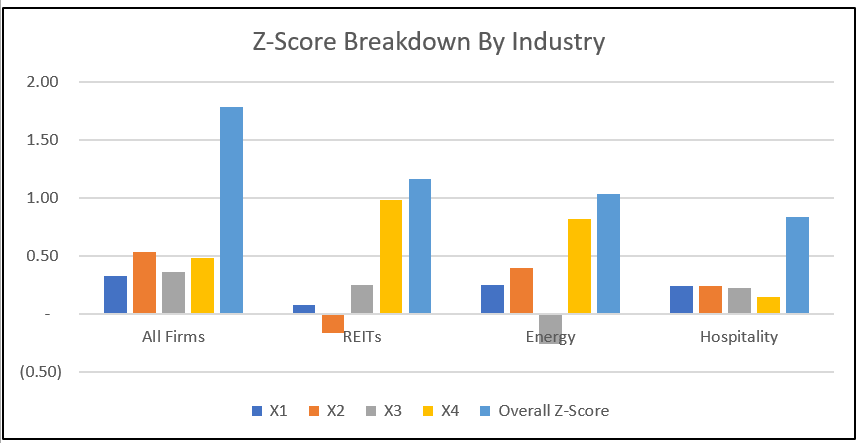
The Z-Score model for non-manufacturing firms has four parameters as follows:
- X1 (Measures liquid assets in relation to the size of the company) = (current assets − current liabilities) / total assets
- X2 (Measures profitability that reflects the company’s age and earning power) = retained earnings / total assets
- X3 (Measures operating efficiency) = earnings before interest and taxes / total assets
- X4 (Measures leverage based on the book value) = book value of equity / total liabilities
Each one of these factors is multiplied by a scaling factor. The results are then added together to give the final score. In the chart below, we can see some striking results. Leo Tolstoy wrote that “All happy families are alike; each unhappy family is unhappy in its own way.” This seems to be true with unhappy industries as well. The hospitality industry scores poorly by being generally low on all measures. REITs’ poor performance is driven by bad profitability ratings (X2). Energy firms are suffering from extremely poor EBIT numbers (X3) in relation to their assets.
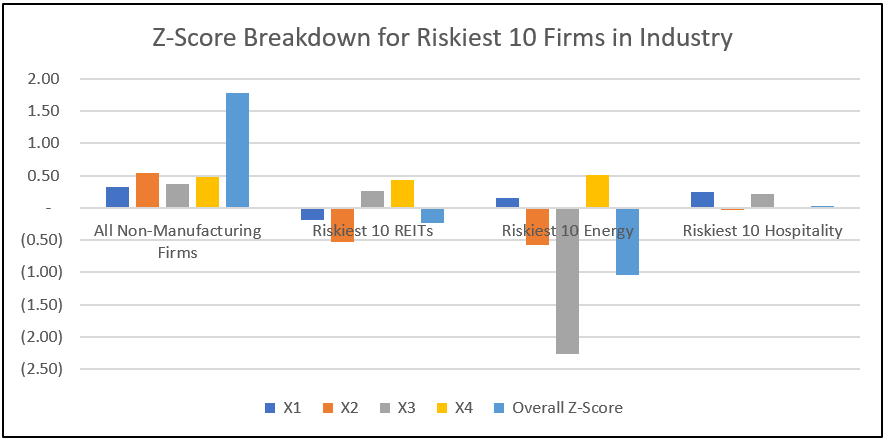
An analysis of the riskiest 10 firms in each industry shows a magnification of these trends. High-risk hospitality firms continue to score poorly across all measures. REITs continue to show a negative score on profitability, but liquidity also turns negative. Most dramatically, high-risk energy firms have a dramatically negative operating-efficiency score most likely driven by negative EBIT. Profitability also turns negative.
Conclusion
While the stock market continues to hit record highs, there is reason to be cautious. In the simplest sense, bankruptcy usually happens when a firm has borrowed money that it cannot repay or service. The New York Times noted the spree of borrowing by firm when it reported that “Heavily indebted companies — with below-investment-grade, or junk, credit ratings — issued a record $48 billion in new bonds in June alone.” Given the Federal Reserve Bank’s tremendous influence in the economy, it is difficult to understand how this will play out. We are indeed in uncharted waters, but one thing is for sure, according to Altman’s Z-Score, there is a lot of bankruptcy risk in S&P 500 firms right now.
Data Provided by TagniFi. More at https://tagnifi.com/.
Charlie Strout is founder of Seven Shadow LLC, and independent research and consulting firm. More on Charlie can be found at https://charliestrout.com/.
DISCLAIMER: This article is for informational purposes only. Nothing in it is intended as advice to buy or sell a security.